

PP - Glass Fiber Reinforced | CE Certification | Factory
We supply PP - Glass Fiber Reinforced parts and compounds for automotive, industrial, and consumer goods. Our material blends polypropylene with glass fiber to deliver high tensile strength, stiffness, and chemical resistance while keeping cost down. With CE Certification, customers can trust safety and compliance across markets. Our Factory operates with strict QC, from resin selection to finished parts, ensuring consistent fiber distribution and dimensional stability. We offer cut-to-size sheets, pellets, and molded components, plus custom color and grade options. Typical applications include housings, brackets, and protection shells requiring lightweight yet strong performance. We provide technical support, testing reports, and certifications to streamline procurement and compliance. Lead times are short thanks to in-house extrusion and molding capacity, and we can tailor glass fiber content to 10-60% depending on stiffness vs weight tradeoffs. If you need reliable PP - Glass Fiber Reinforced solutions for mass production, contact our team for datasheets, CE Certification packages, and factory-ready samples.


PP - Glass Fiber Reinforced Manufacturer Trusted by Pros
Polypropylene reinforced with glass fibers offers a high‑performance option for engineers who demand reliability. By pairing a lightweight, chemical‑resistant base resin with carefully selected glass content, this material delivers greater stiffness, improved strength, and better dimensional stability, while remaining moldable and cost‑effective. It suits automotive components, electrical housings, plumbing fittings, and consumer devices, providing dependable performance across demanding environments. Tailoring the glass content lets designers balance impact resistance and rigidity to meet exact application needs. Global buyers benefit from a partner that can deliver consistent quality at scale. A robust PP‑GF program combines rigorous QA, standardized testing, and traceability with flexible formulation options, custom color and additive profiles, and reliable lead times. From prototyping to production, such collaborations optimize compatibility with common injection molding and extrusion workflows, offer international certifications, and support timely delivery. For professionals seeking enduring performance, this reinforced polypropylene supplies proven results through global logistics and technical support.
{ PP - Glass Fiber Reinforced Manufacturer Trusted by Pros}
| Product Type | Fiber Content (wt%) | Resin Matrix | Tensile Strength (MPa) | Tensile Modulus (GPa) | Flexural Strength (MPa) | Flexural Modulus (GPa) | Density (g/cm3) | Thermal Conductivity (W/mK) | Impact Resistance (kJ/m2) | Fabrication Process | Typical Applications |
|---|---|---|---|---|---|---|---|---|---|---|---|
| Unidirectional GFRP Rod | 60 | Epoxy | 900 | 35 | 800 | 28 | 1.95 | 0.45 | 40 | Vacuum Infusion | Structural components in automotive and machinery |
| Woven GFRP Sheet | 45 | Polyester | 700 | 31 | 600 | 26 | 1.90 | 0.42 | 28 | Hand Lay-Up / Vacuum Bagging | Marine decking, roofing panels |
| GFRP Panel | 35 | Vinylester | 550 | 28 | 500 | 25 | 1.88 | 0.40 | 22 | Resin Transfer Molding (RTM) | Architectural panels, partitions |
| GFRP Tube | 55 | Epoxy | 620 | 32 | 520 | 26 | 1.87 | 0.44 | 26 | Filament winding | Mechanical supports, frames |
| Chopped Strand GFRP Mat | 50 | Polyester | 520 | 27 | 480 | 24 | 1.85 | 0.38 | 23 | Hand lay-up with chopped strands | Automotive interior parts, housings |
Related Products


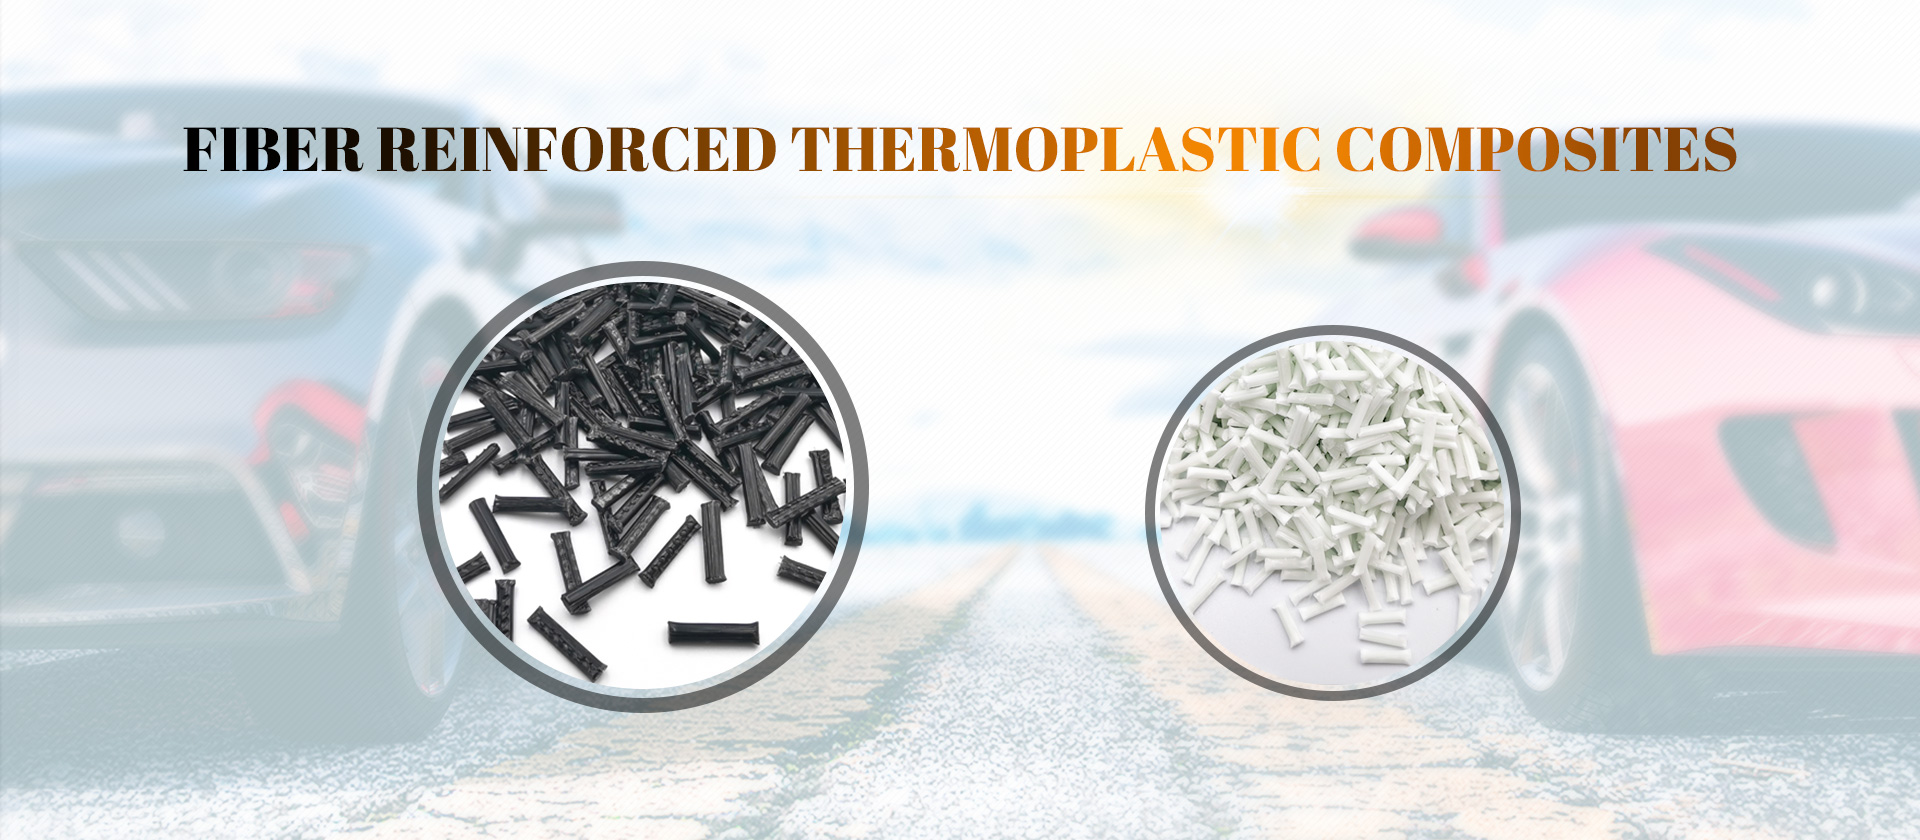
PP - Glass Fiber Reinforced Trusted by Pros Guarantees Peak Performance
Top Selling Products


- Related Blog
- Reviews

-

Phone
-

E-mail
-

Top